Learnings from 2021. Virtual Fitting Room Consumer Insights
January 20, 2022
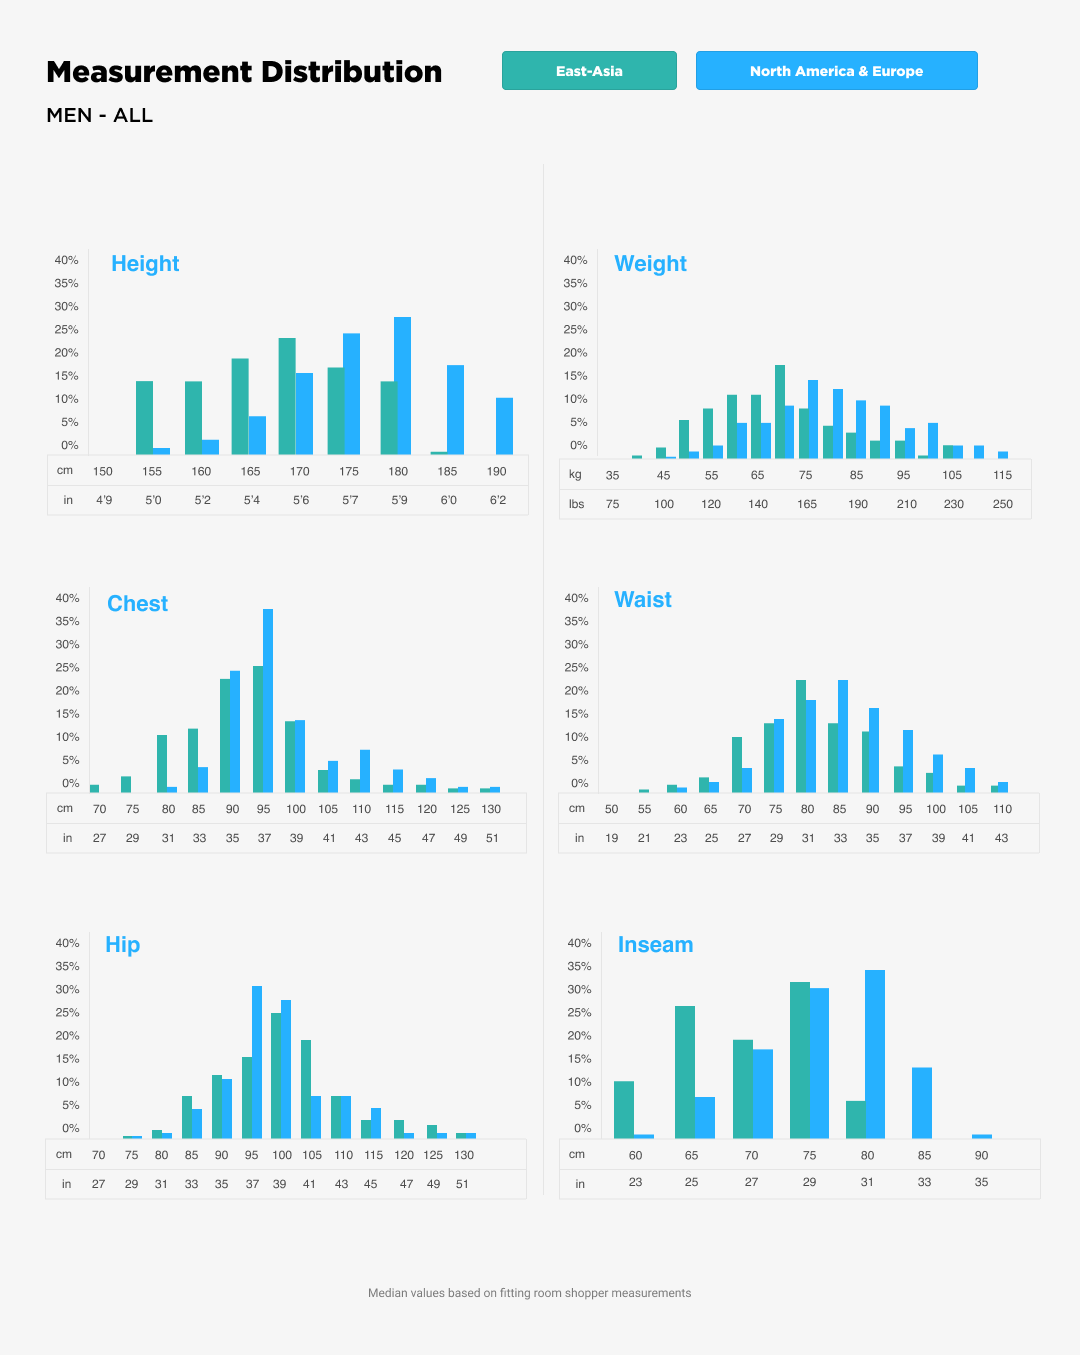
How is the average shopper built? We analysed over 9 million users from our partners from various clothing categories, dividing the results for North America, Europe and East Asia. Measurement distribution across regions for men and women.
We analysed over 9 million users from our partners from various clothing categories, looking at measurement data from 2021.
Dividing the results for North America, Europe and East Asia revealed certain similarities and some significant differences between markets. Regardless of region, our virtual fitting solution continues to positively impact conversions and engagement for all our clients.
How is the average shopper built? Differences between North American, European and Asian customers’. Let’s dig deeper and find out.
With the ongoing pandemic, e-commerce continued to rise rapidly at 13% versus 2020.
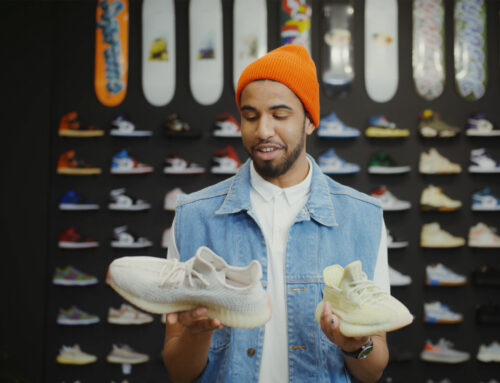
At the same time, product returns increased further, a survey of US shoppers in November found that 58% of respondents were bracketing online purchases, compared to 40% in 2017. In 2020, product returns generated 16 million metric tons of carbon emissions.
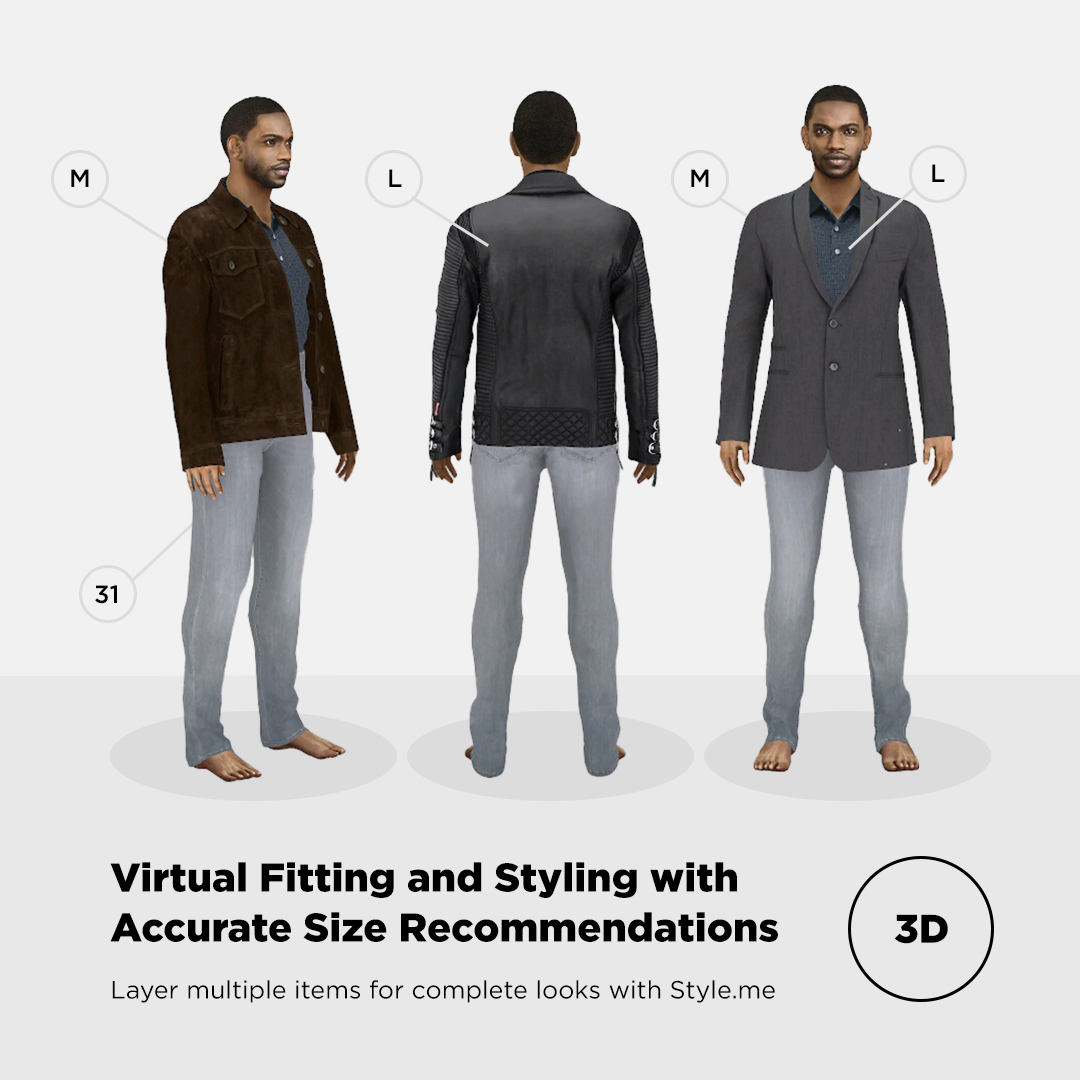
The importance of clearly communicating fit, size and offering visualization for online stores is key to both increasing confidence to purchase, as well as reducing returns and the knock-on environmental impact.
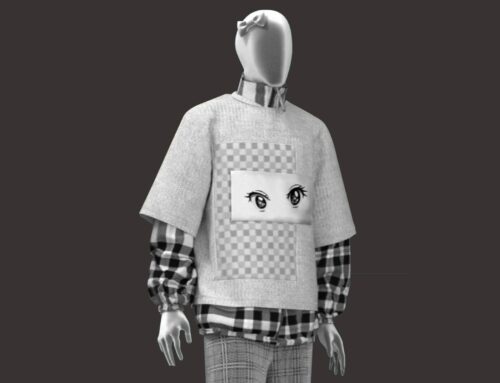
We’ve compiled the data to create a shopper profile for 2021.
Our virtual fitting room user views 11 pages per session on average, compared with just 3 for non-fitting room users. The elevated experience on average drives conversion up by 96% with AOV rising by 9%.
Fitting room user profile 2021
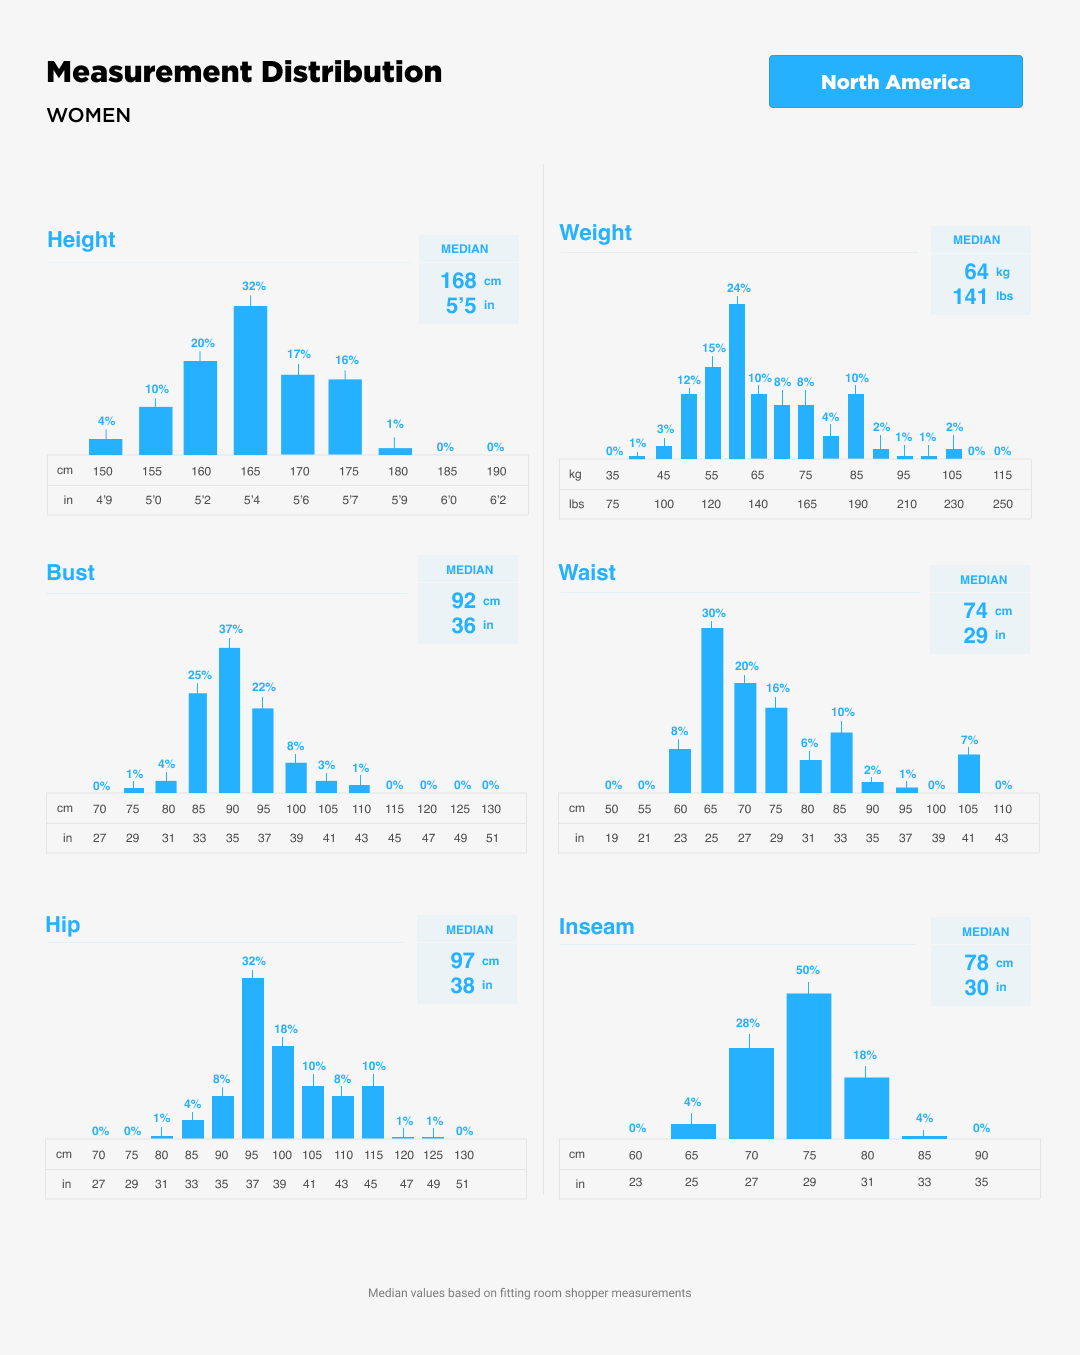
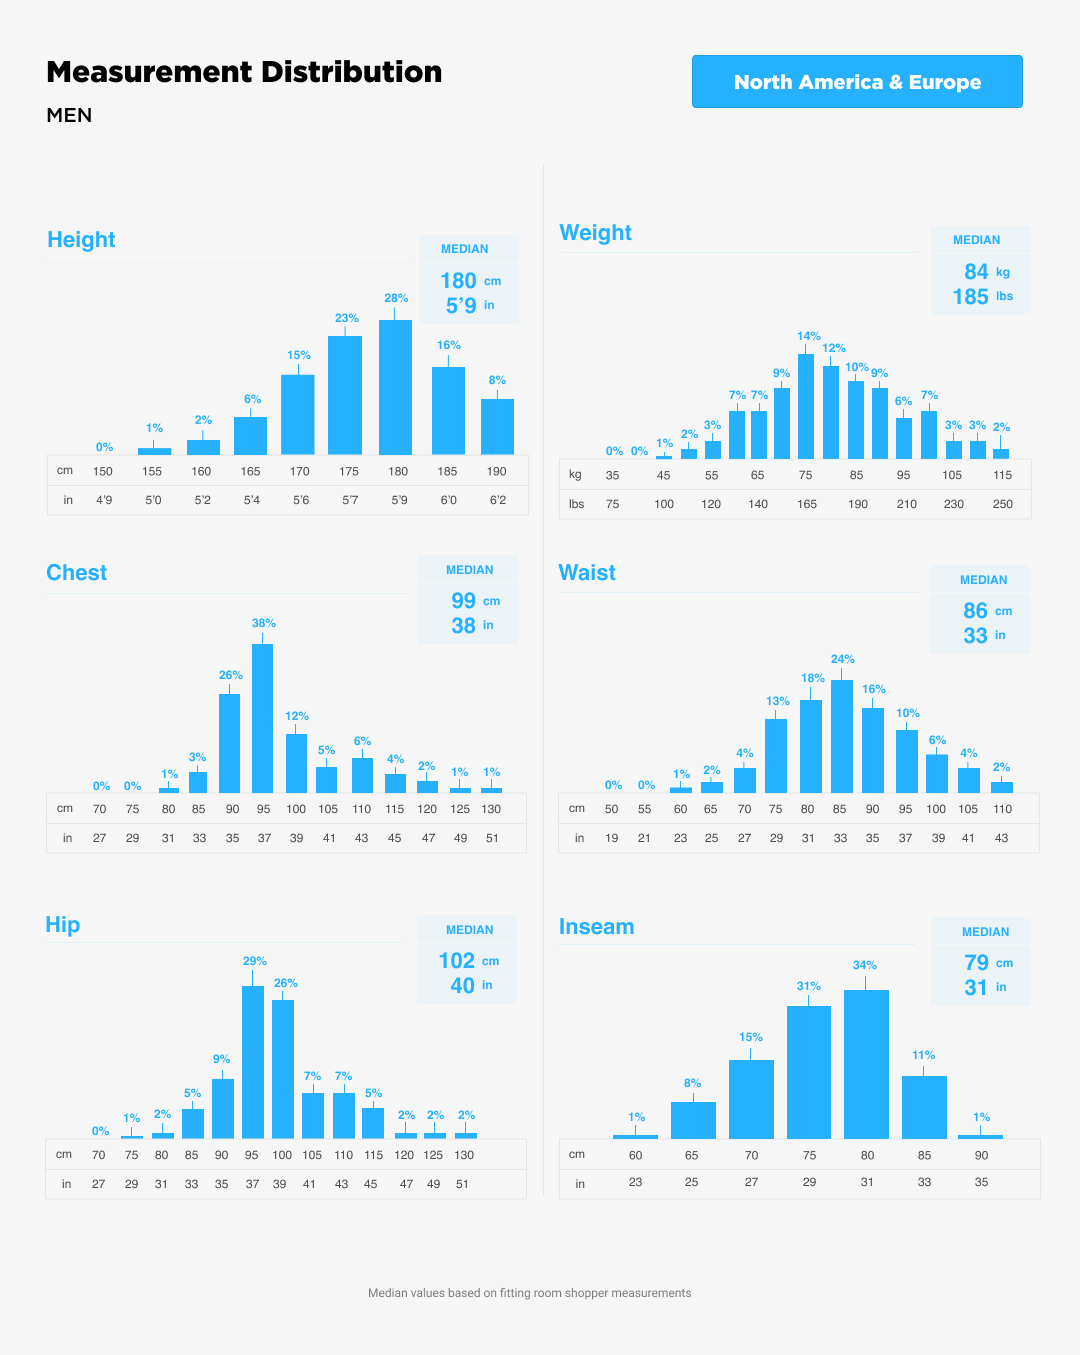
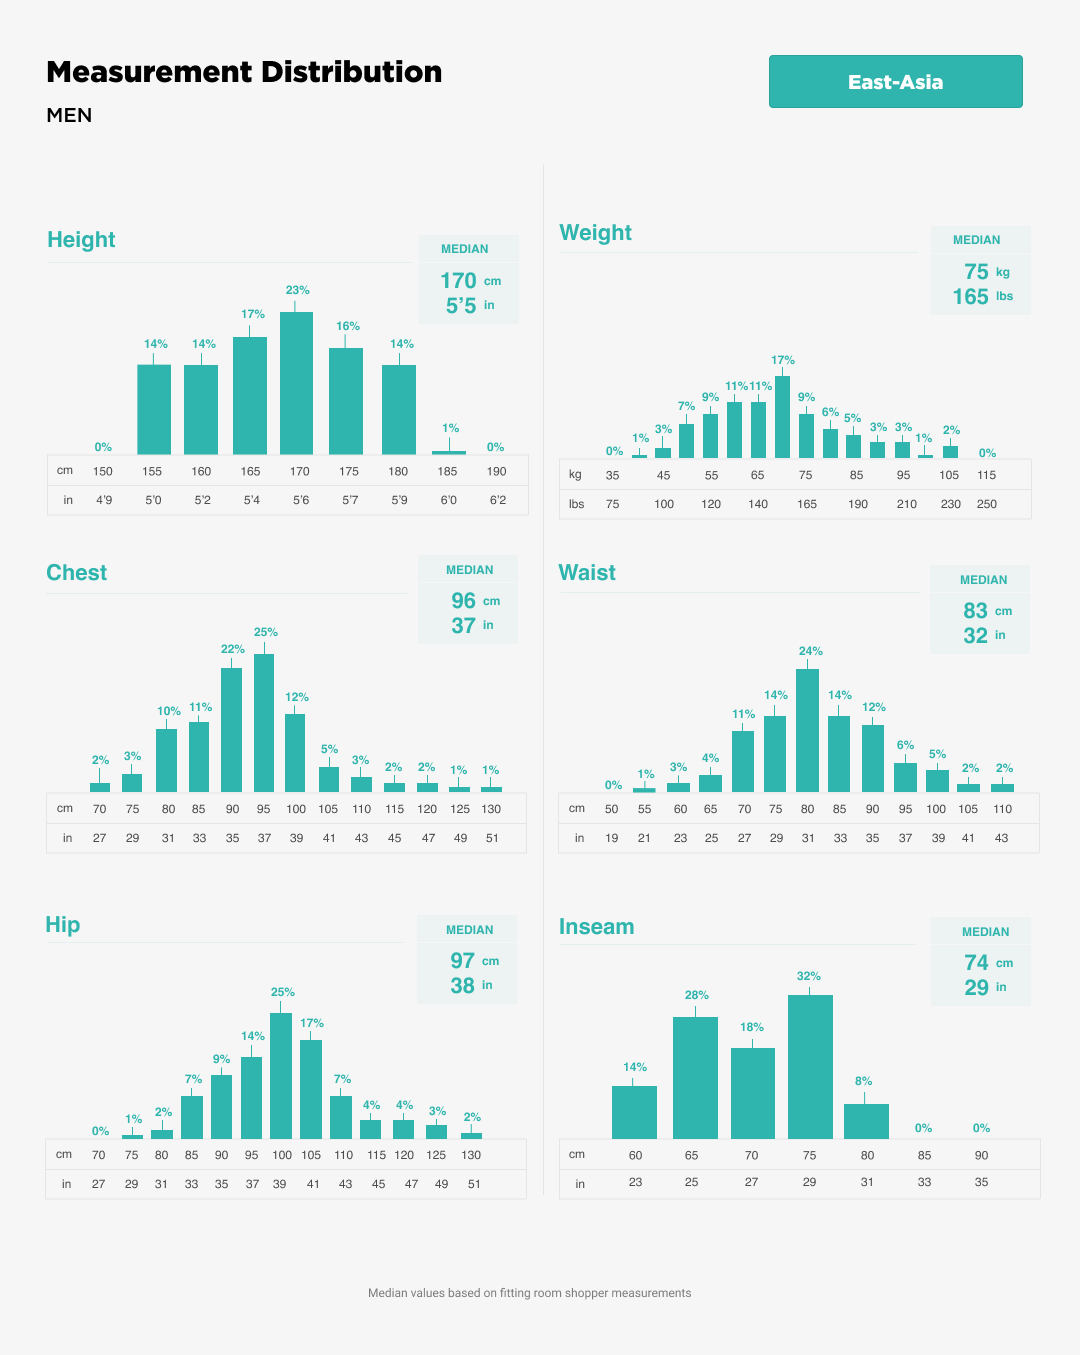
Measurement distribution across regions.
Click images to enlarge
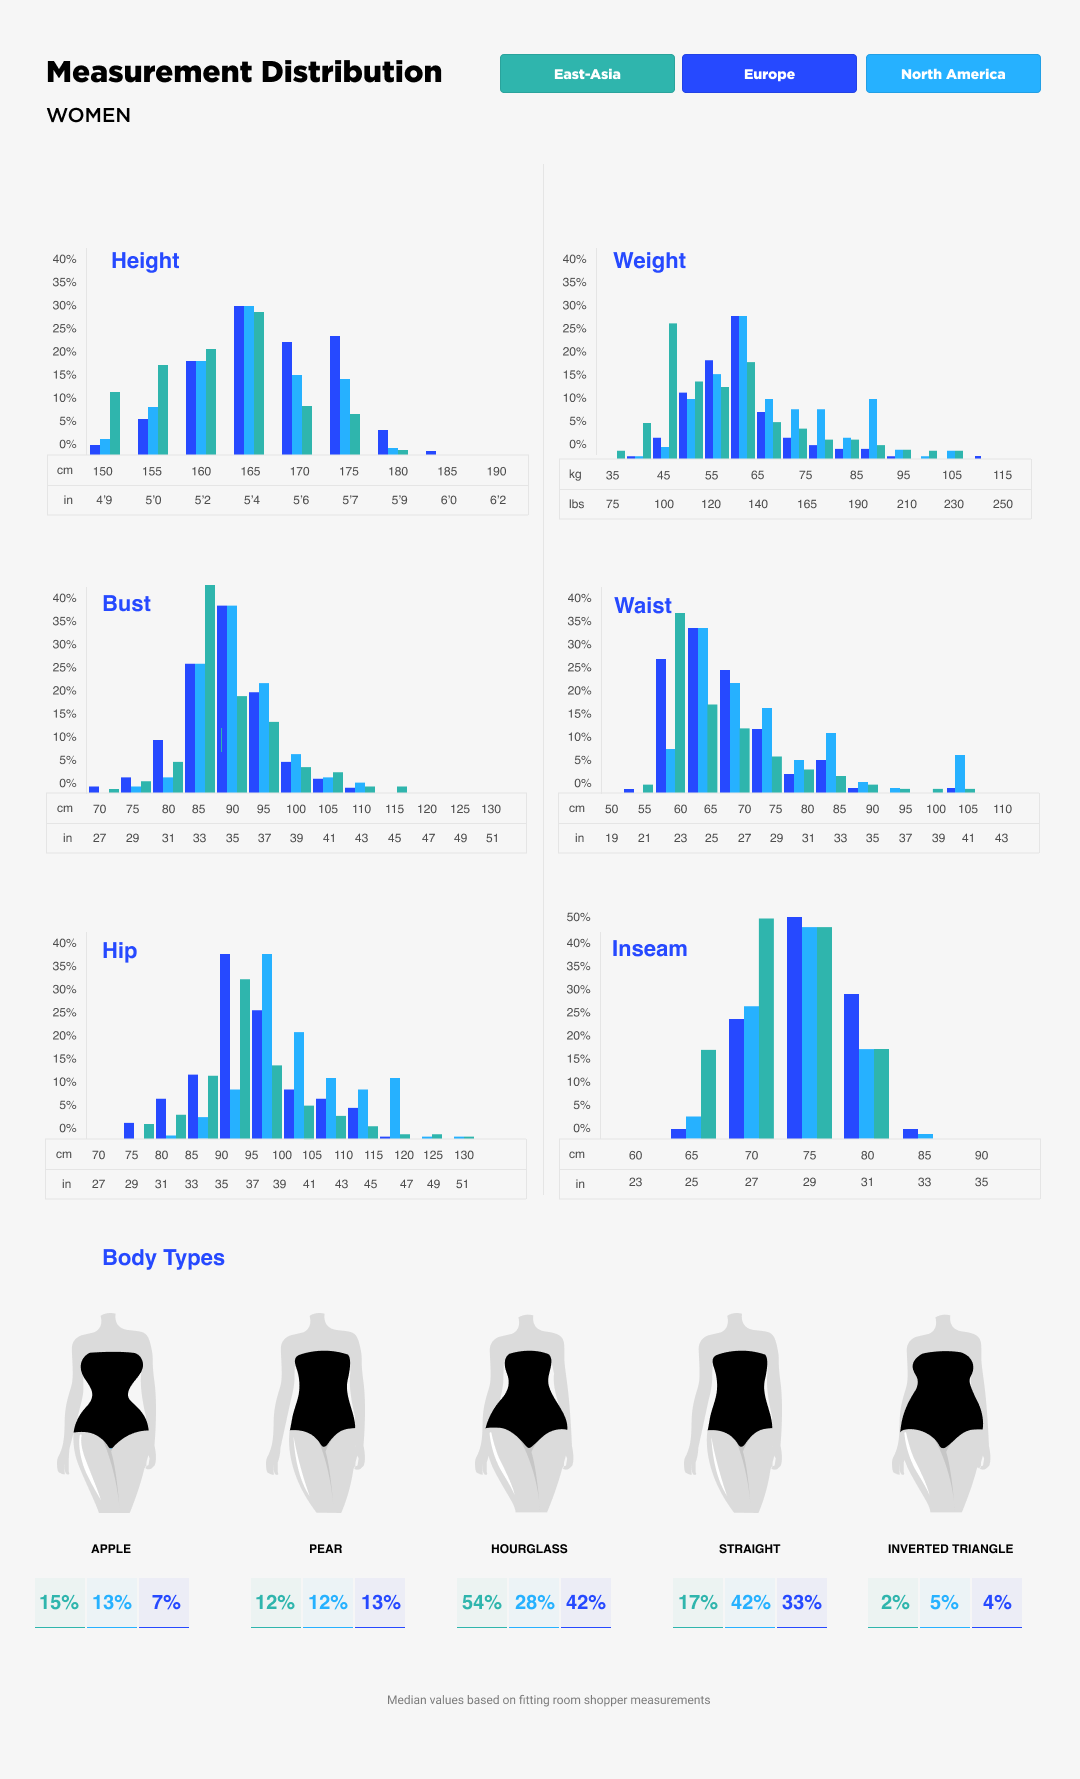
Women
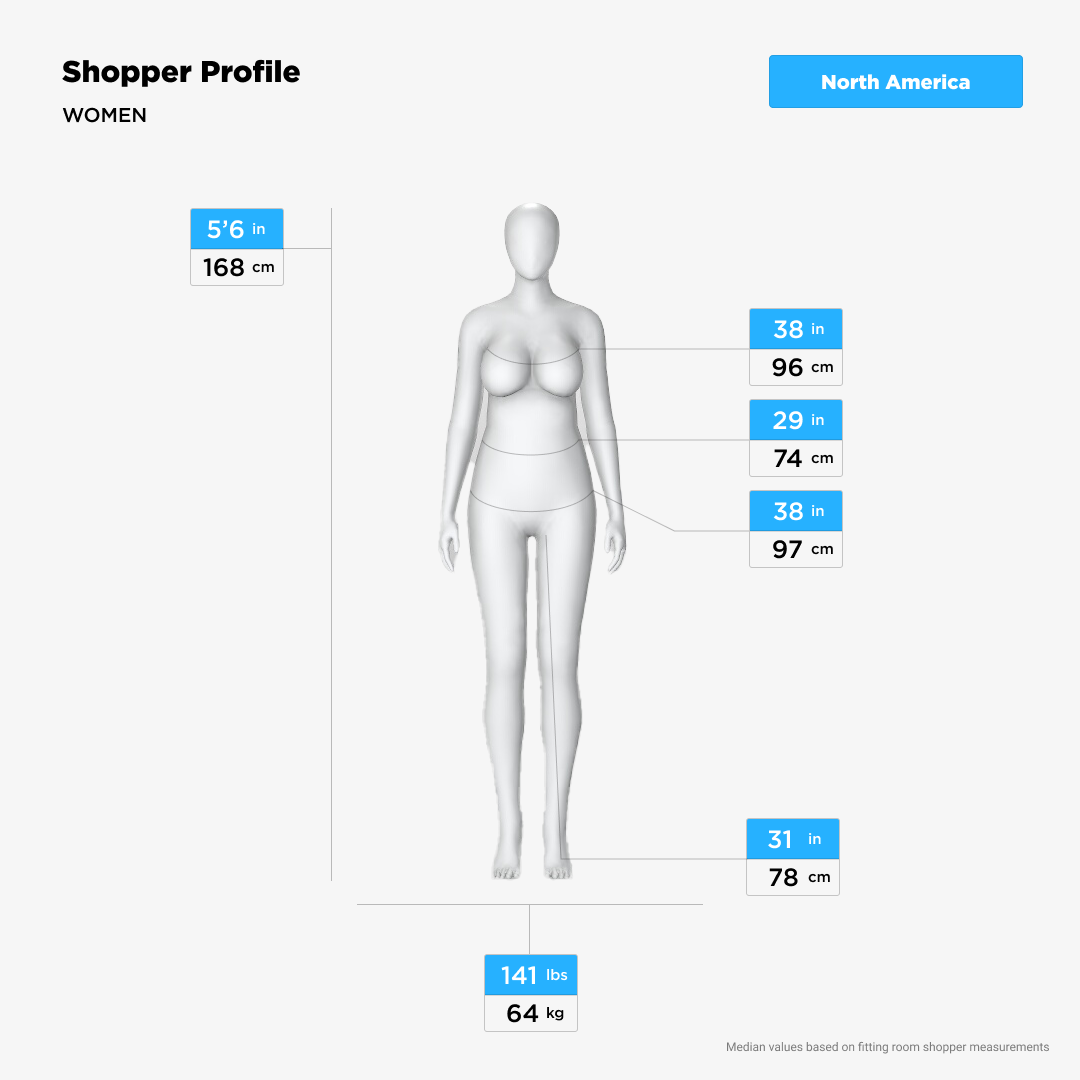
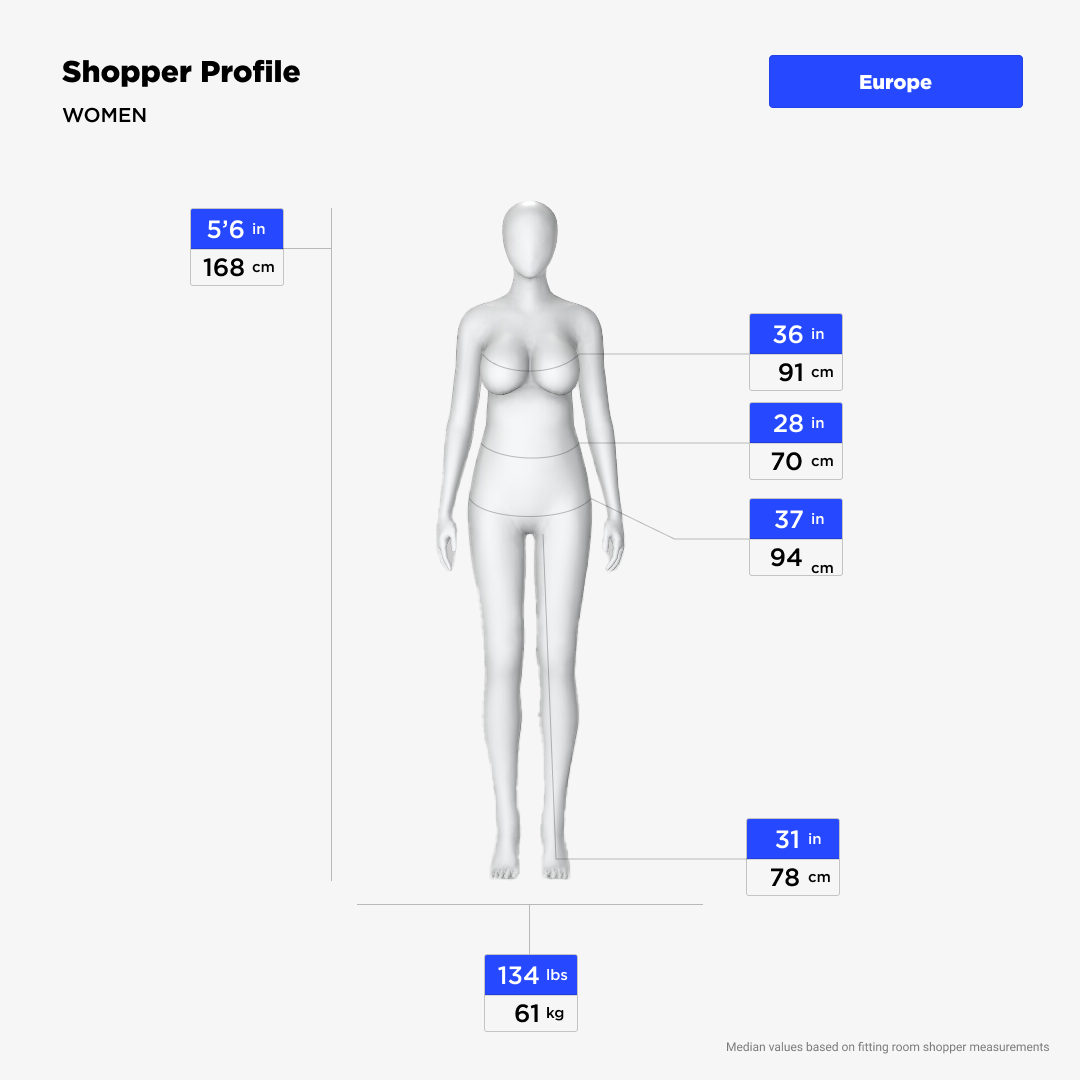
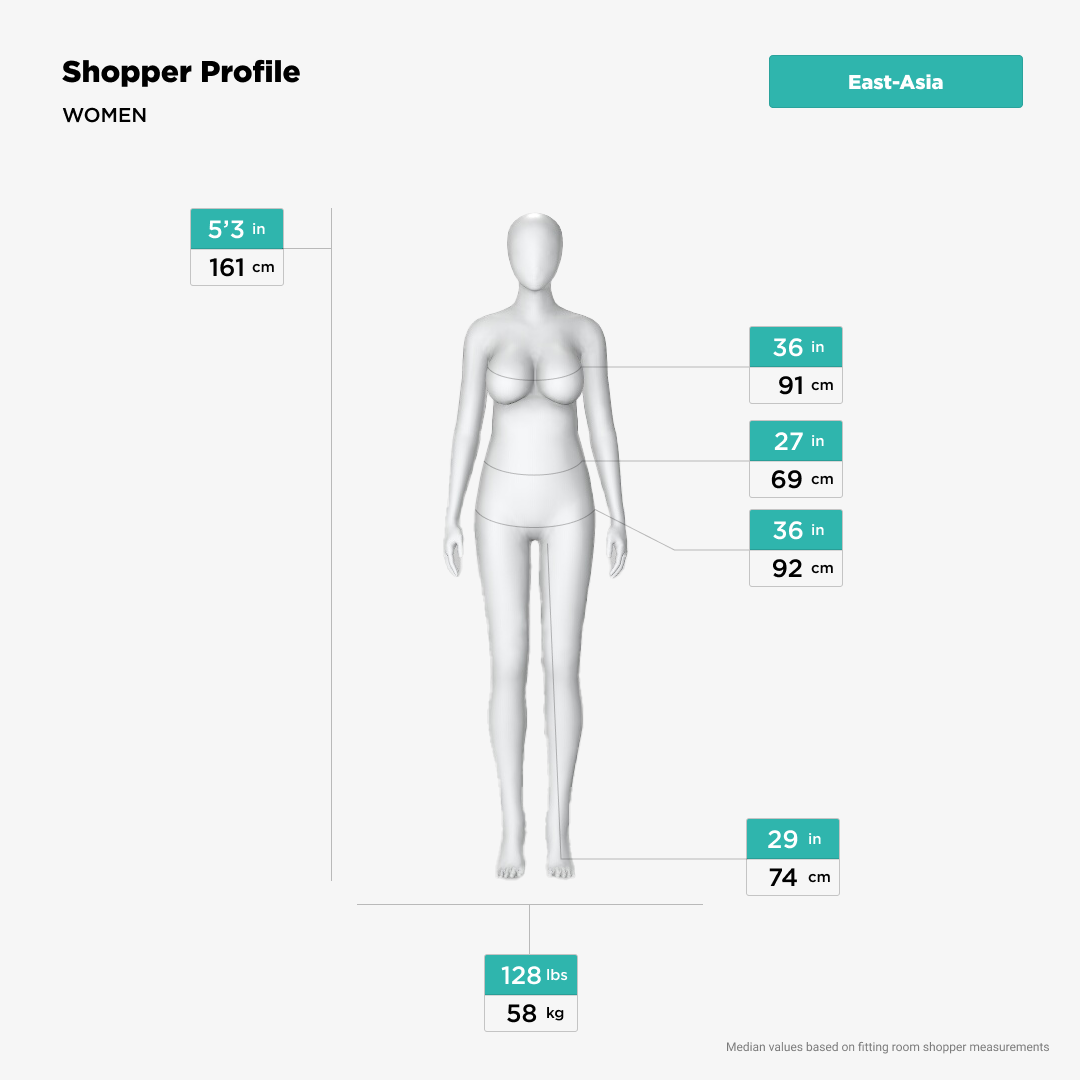

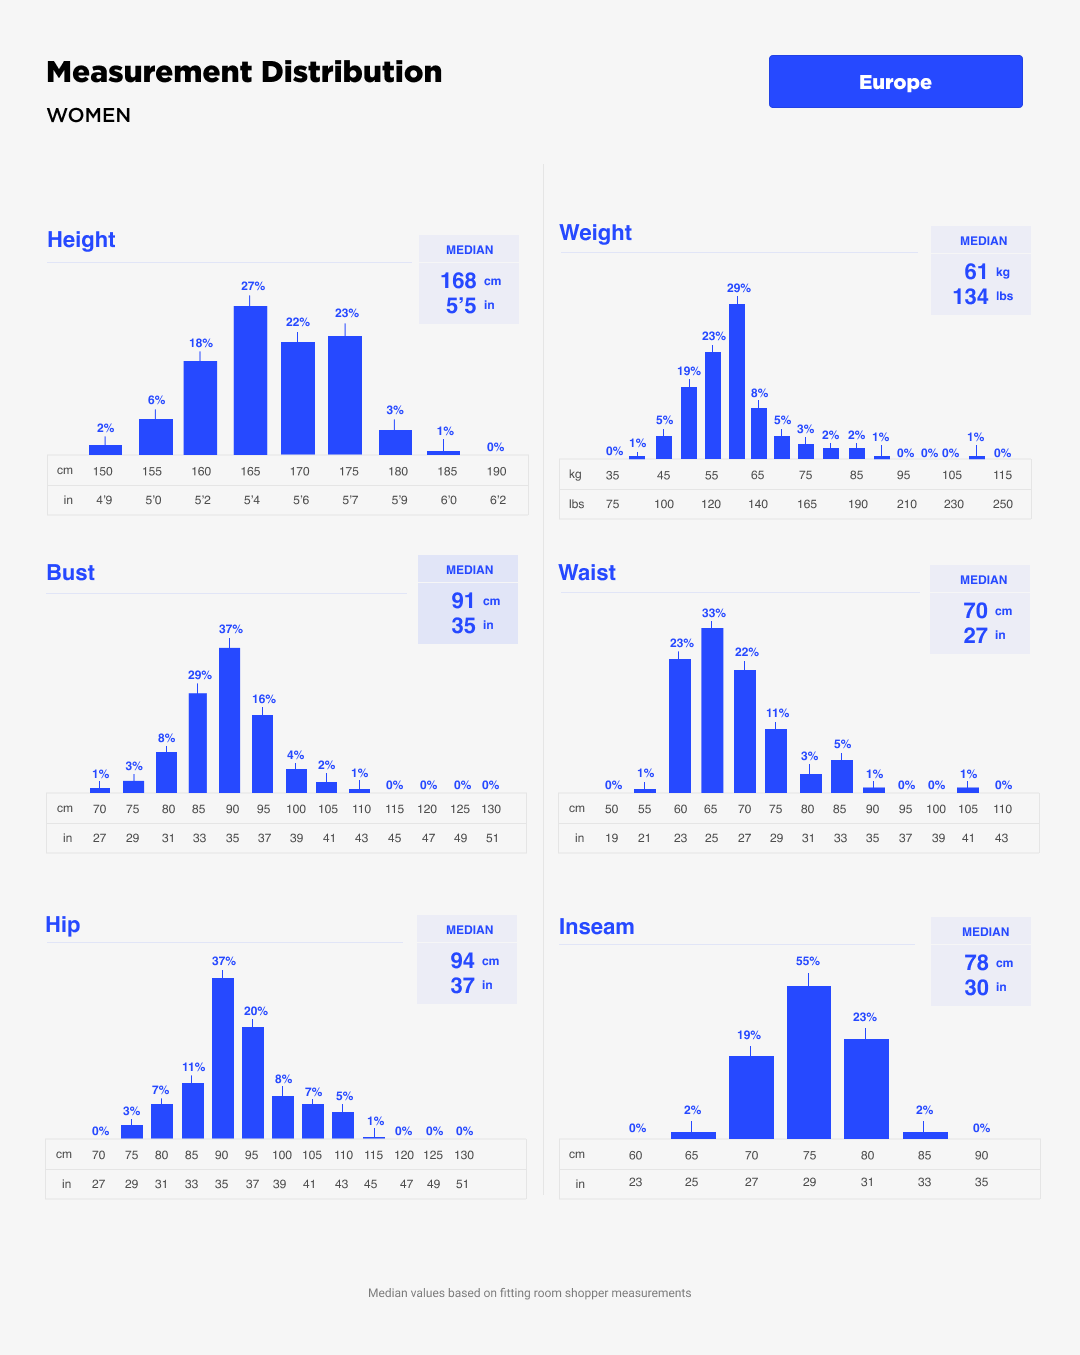

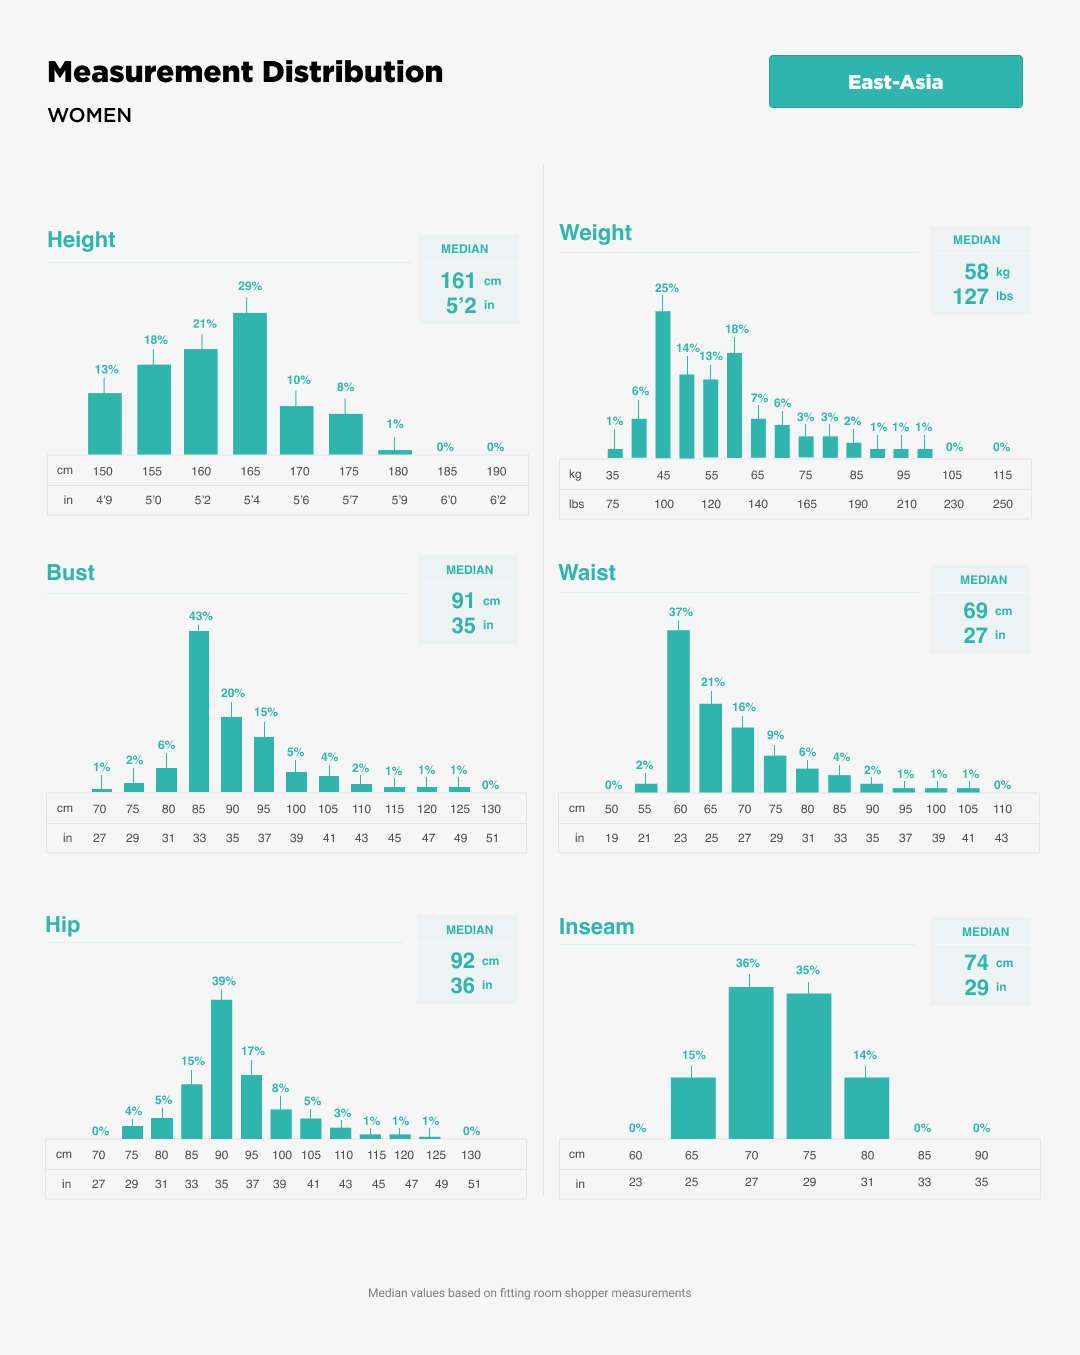

Comparing measurements across three regions
North America, Europe and East Asia
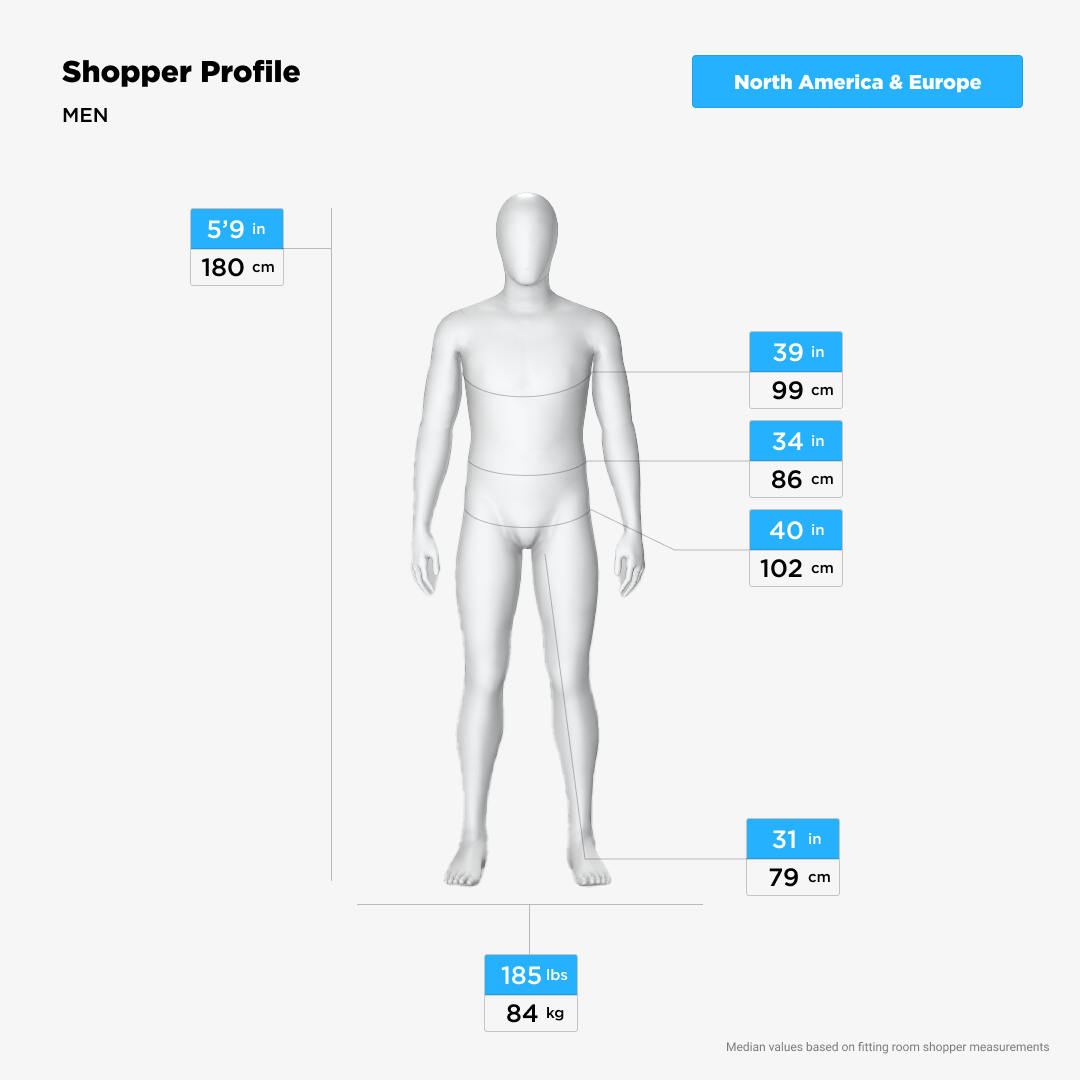
Men
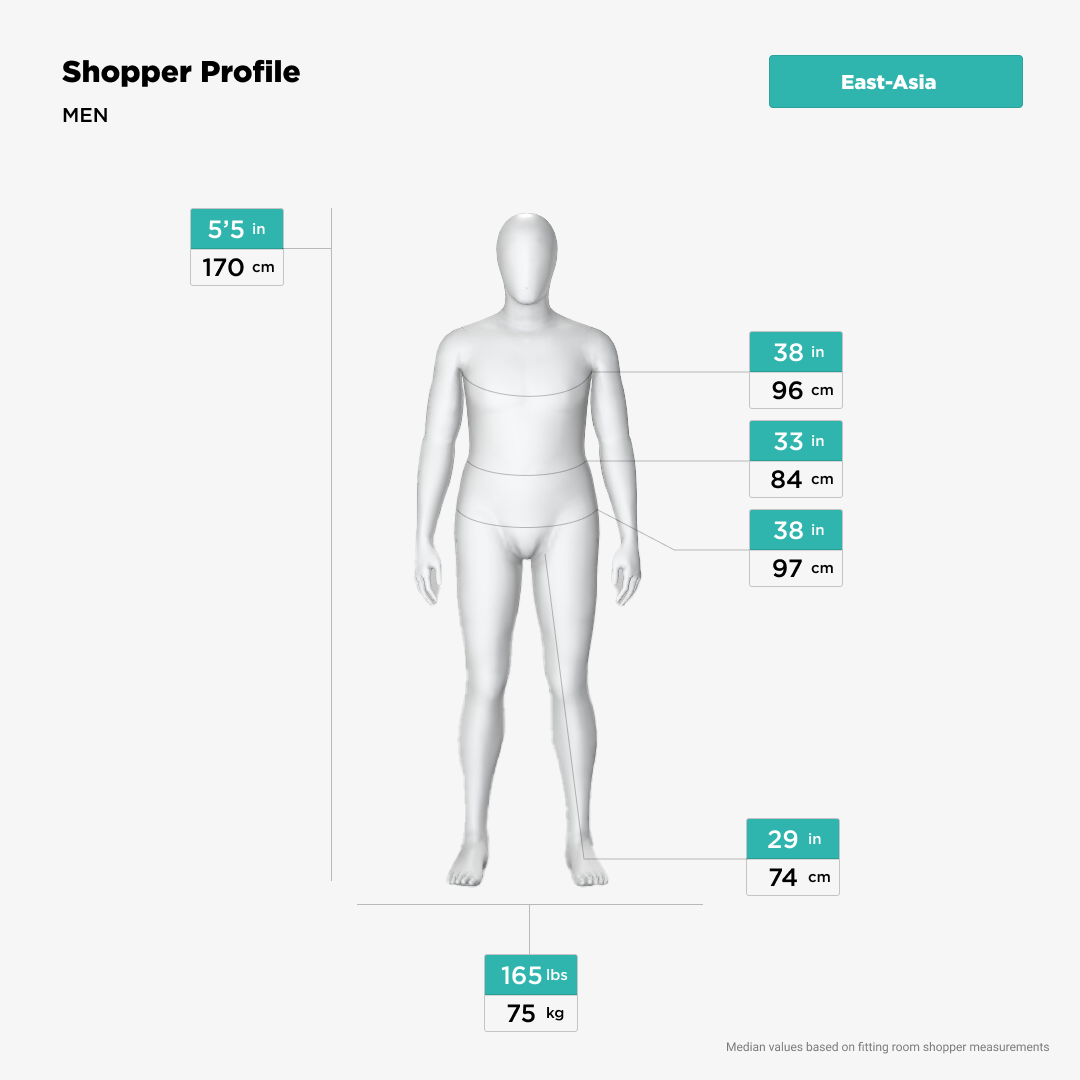
Note: All data collected is anonymized based on a cross section of users and markets.
How does your shopper profile compare to these results?
Get started with virtual fitting and witness the immediate impact, making 2022 a perfect fit for your brand.